


Ethereum forms two bullish flag patterns
Both patterns’ measured moves indicate a new yearly high
A move to $2600 would confirm the biggest bullish flag
The cryptocurrency market remains resilient despite the ongoing scandals that affect the industry. Investors still believe in the leading cryptocurrency’s potential; as such, Bitcoin, Ethereum, and other coins trade close to their 2023 high.
Bitcoin made a new high for the year recently, but Ethereum did not. Hence, if Bitcoin is leading, then Ethereum should follow.
Interestingly, the technical analysis shows two bullish flag patterns. They both point to new highs for the year; any downside movement should be taken with a grain of salt.

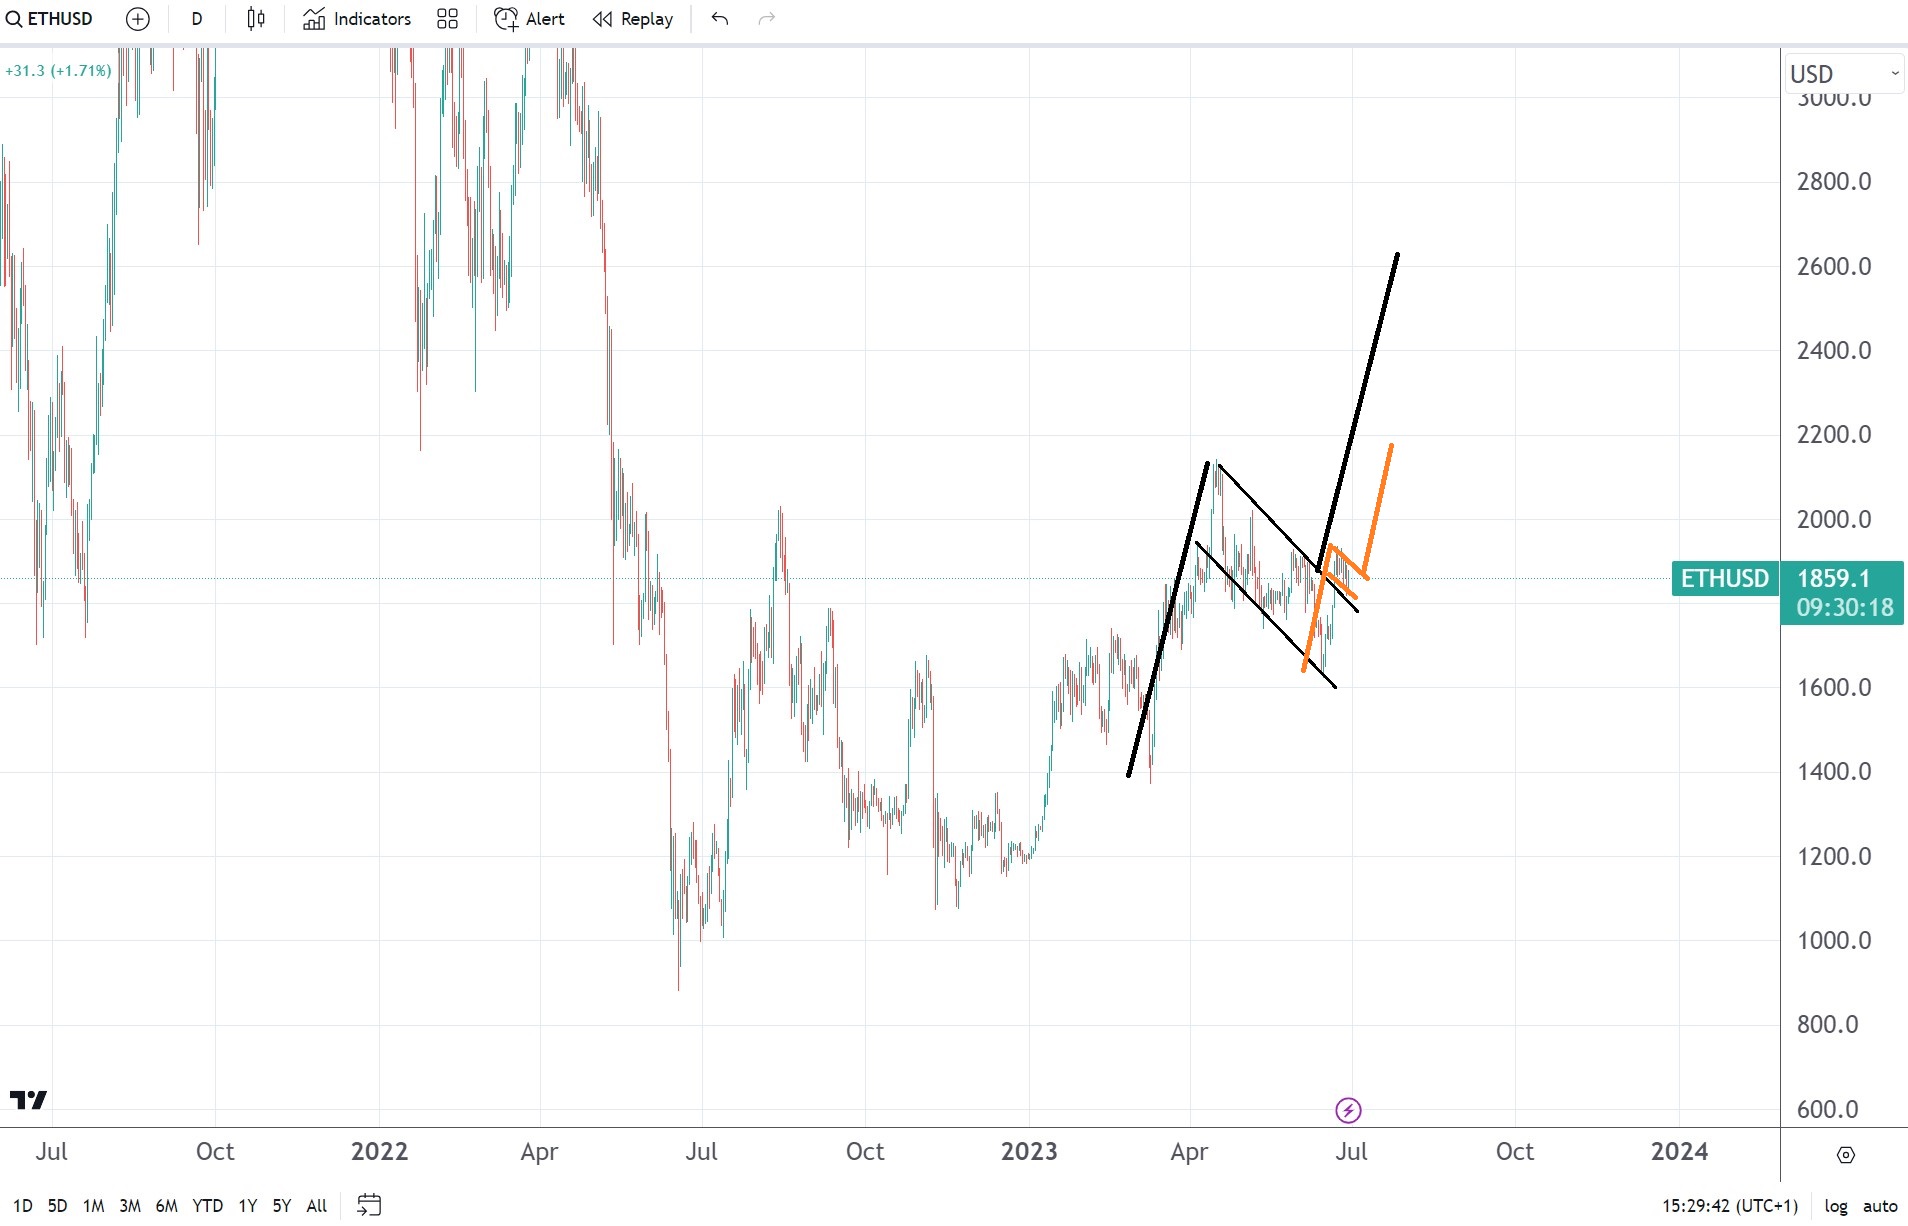
Ethereum chart by TradingView
$2,000 offers stiff resistance
The market failed at the $2,000 level recently. Even though it made a new high for the year, the bears sold the round level, and the price quickly fell to $1,600.
But in doing so, it did not break the higher lows series. Also, two bullish flag patterns are visible, with measured moves above $2,000.
The biggest pattern, seen in black above, points to a move to $2,600. The smallest one, to a move to $2,200.
In both cases, it means that Ethereum will make a new high for the year, and the bias remains bullish as long as the price action holds above $1,600.
Source link By Mircea Vasiu


 Bitcoin
  Ethereum
  Tether
  BNB
BNB  Solana
  USDC
USDC  XRP
XRP  Dogecoin
  Toncoin
Be the first to comment